AIRSPEED MEASUREMENT IN THE WIND TUNNEL
Airspeed
measured by instruments is referred to as IAS, indicated airspeed, whether true
airspeed is referred to as TAS.
Measurement devices:
Fixed anemometer:

Fig. 1: the anemometer in position in the test
room.
The first
airspeed measurement device is a small anemometer. It gives airspeed with a
precision of 0.1 km/h.
I’ve made
an attempt to calibrate it, but it was not very meaningful. There is a link
where the experiment is described (in French):
http://g.rouby.free.fr/Calibrageanemometre.htm
Although I
couldn’t reach speeds above 30 km/h during the experiment, it looks like the
anemometer needs a correction by some ratio, with true speed against indicated
airspeed being a linear function:
TAS = 0.8832 * IAS + 0.2
This is
quite surprising because I would have expected IAS to be inferior to TAS.
One more
thing to say is that the anemometer displays an averaged value of airspeed; it
takes around 20 to 30 seconds so that the displayed airspeed gets stabilized.
The
anemometer is positioned near the bottom right corner of the test room
entrance:
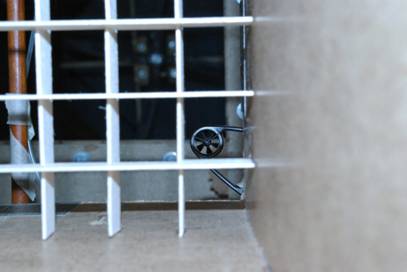
Fig. 2: the anemometer seen from the entrance
cone.
In this
position, the anemometer is not in the influence range of the tested propeller,
when the tested propeller is spinning in static conditions, wind tunnel’s door
opened.
Also, at
this position the TAS should be close to the TAS near the test room’s center
line. This will be discussed later in this report.
The
anemometer will give me a reference value for airspeed.
Pitot tube:
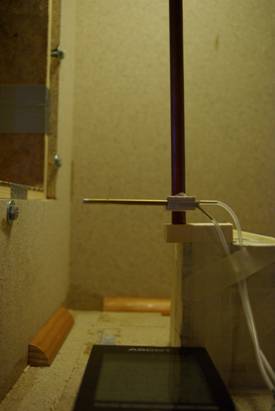
Fig. 3: the Pitot tube in the test room.
The Pitot
tube is connected to a data logger, this compensate for the low precision (1
km/h).
For the
purpose of this experiment, the Pitot tube is fixed on a very cheap device that
allows it to be positioned almost anywhere in the test room.
First, I’ve
set it near the anemometer and run two series of measurements at increasing
speeds, in order to compare the both measurements at similar positions.
Wind
tunnel’s speed is increased in four steps then shut down. A picture of the
anemometer’s display is taken every 10 seconds; speed is corrected with the
above formula and compared with the logged Pitot tube’s speed.
We can see
that the anemometer, as expected, needs some time to reach a stabilized value
while the Pitot tube records any change in wind tunnel’s speed quite
instantaneously:
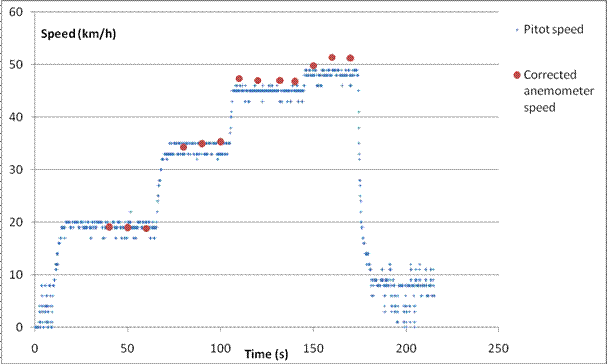
Fig. 4: Pitot tube and anemometer IAS during 1st
run.

Fig. 5: Pitot tube and anemometer IAS during 2nd
run.
The maximum
speed for the wind tunnel is around 52 km/h, according to the anemometer, used
as a reference.
We can see
that the Pitot tube seems to display an under estimated speed, according to the
reference speed. But in fact, it is hard to conclude because the Pitot tube and
the anemometer are not exactly at the same position, the Pitot tube being
nearly 2 cm more “inside” the airflow. At this point, and as shown later, the
TAS might indeed be a little less.
So finally,
I can’t really conclude about airspeed measurement accuracy. Both seem quite
coherent. The Pitot tube has this advantage that it can be put in an aircraft
for test flights.
Airspeed distribution at
the entrance of the test room:
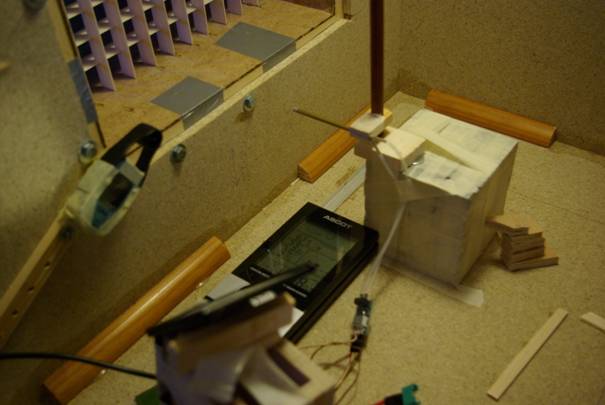
Fig. 6: view of the test room.
The
entrance of the test room is a square of 30 cm sides. The Pitot tube is
positioned under the longitudinal center line, the height is adjustable. The
Pitot tube is at the same distance of the honeycomb as the propeller should be
for propeller tests.
I’ve made
10 runs, at full speed, starting at 16.4 cm under the longitudinal axis and
going up to the center line.
For each
run, I compared the Pitot tube IAS with the stabilized anemometer IAS.
The maximal
speed of the wind tunnel depends upon the wind tunnel’s motor, which is losing
power under its increase in temperature. So it’s never really twice the same.
The following values of IAS are corrected for anemometer reference speed set to
52 km/h. Those are the speed variations at different distances from the center
line:
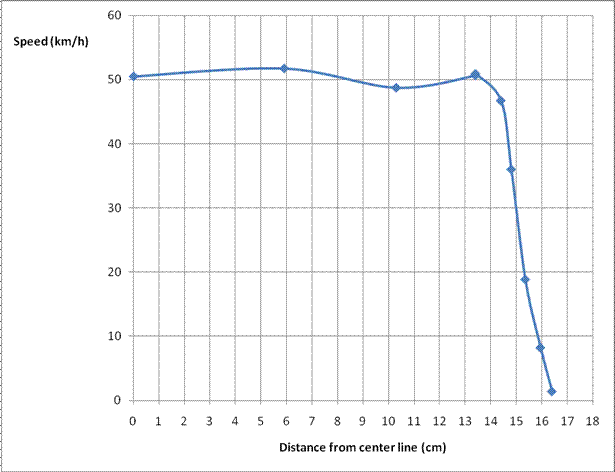
Fig. 7: airspeed distribution in the test room
(propeller position).
This result
can be compared with the equivalent found in the NACA report No. 73. In this
report, similar tests were made for a 1 feet diameter circular section wind
tunnel. On the graph below, curve A is at the entrance of the entrance cone, B
is midway in the entrance cone and C is 5 cm behind the exit side of the
entrance cone, so in a similar position as for the homemade test runs.
Clearly, we
can see that airspeed is disturbed and very fluctuant, while NACA’s model is
very steady. More runs are required, but this is probably due to the poor
quality of the honeycomb, the very short entrance cone and, maybe, to the
effect of vibrations of the Pitot tube’s silicon tubes.
The
airspeed measured at 10.3 cm of the center line is somewhat unexpected and
strangely low compared to airspeed measured at 13.4 cm and 5.9 cm. Looking at
the data from the logger we can see that it’s also the run with the lowest
disturbance.
The blue
line oscillates mostly around 48 to 49 km/h while the two others have 3 km/h
width oscillations.

Fig. 8: logger’s data showing airflow
disturbance.
No runs
were made at longer distance downstream the honeycomb, except one, with the
Pitot tube on the center line, 30 cm from the honeycomb. The speed shows a
little increase at this point, compared to the initial position, with a bit
more than 53 km/h. This is coherent with what we can see on the D and E curves
on the NACA’s graph (D is 20 cm downstream the honeycomb, E is 46 cm).

Fig. 9: Airspeed distribution in the 1 foot
model (NACA report No. 73).
Conclusion:
The results
of this experiment show that both the anemometer and Pitot tube give coherent
value of airspeed.
Steadiness
of the airflow should be improved, or maybe airspeed measurement can be
improved (lower down silicon tubes vibrations?).
This report
gives good references for incoming propeller tests.